Study Economics by Drawing the Graph Before the Words
Study economics by practicing each model in three forms: a graph you can draw from memory, a causal chain in words, and a short calculation. Then mix problem types so you learn which model fits a question. Rereading the textbook builds familiarity; drawing and explaining from a blank page builds exam skill.
Economics students often say the lectures make sense and the exam does not. The reason is that lectures show finished graphs, while exams hand you a scenario and a blank page. To study economics well, you need to practice the step in between: choosing the right model, drawing it, shifting the right curve and explaining what happens next.
This guide fits high school, AP and first year university courses in micro and macro. It gives you a graph drill, a causal chain habit, a worked example with numbers, and a plan for practice that mirrors the exam.
Why is economics hard to study?
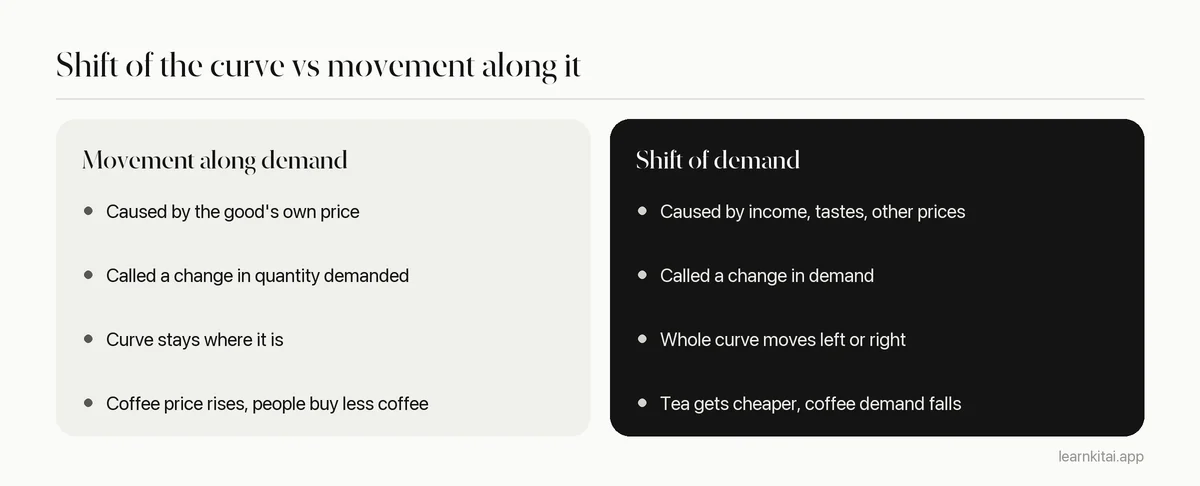
Every idea appears in three forms, words, graphs and math, and exams switch between them without warning. Most of the difficulty comes from small precise distinctions, such as a shift of a curve versus a movement along it, that are easy to blur when you only reread.
An economic model is a simplified story about cause and effect. The graph is a picture of that story, and the math pins down how big each effect is. When you can only do one of the three, you are stuck the moment a question uses another. The fix is to practice translating between them until it feels routine.
How do you learn economics graphs?
Draw each graph from a blank page until you can do it without looking: axes, curves, equilibrium, then a shift and the new equilibrium. Say out loud what moved and why. Copying a finished graph from the book teaches far less than rebuilding it.
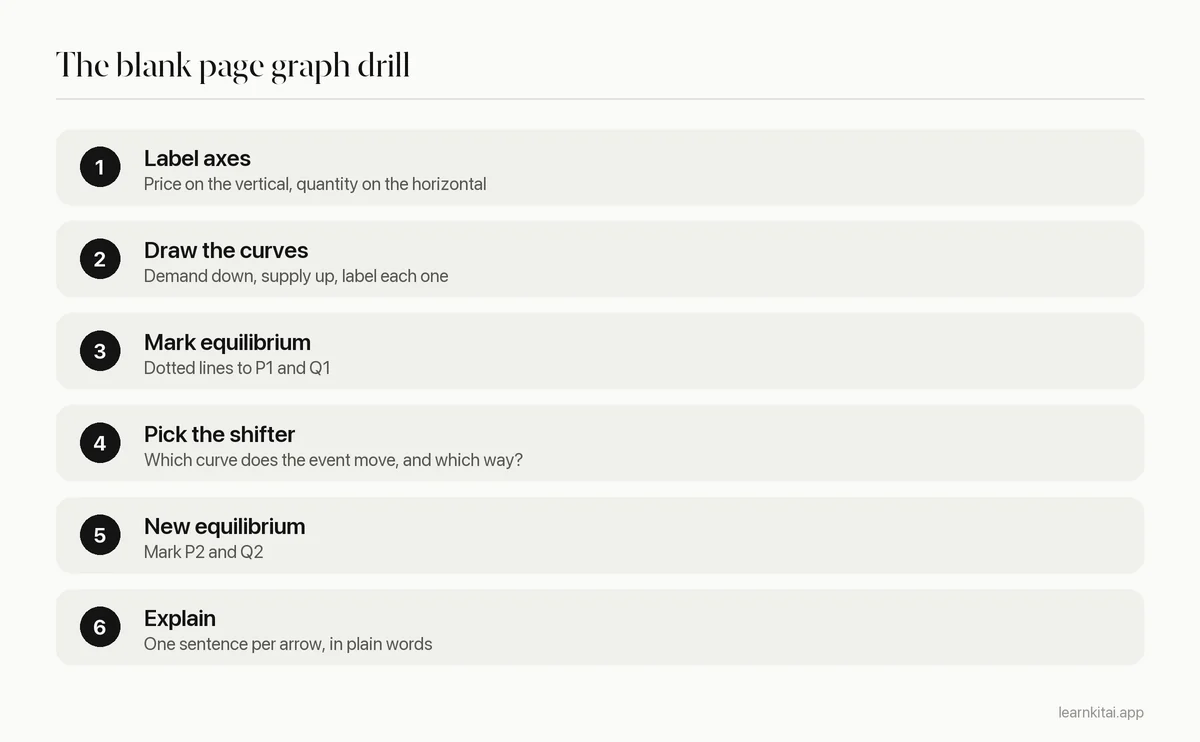
The fourth step is where most marks are lost. Ask whether the event changes buyers' willingness to pay at every price, or sellers' costs at every price. The first shifts demand, the second shifts supply. A change in the good's own price never shifts its own curve; it moves you along it.
How to study economics with causal chains
Write each scenario as a chain of arrows: event, which curve shifts, what happens to price and quantity, and any knock-on effects. Chains force you to justify every step, and they turn directly into exam answers.
Here is a worked example. A frost destroys part of the orange harvest.
- Fewer oranges can be sold at every price, so supply shifts left.
- At the old price there is now a shortage, so price rises.
- Buyers respond to the higher price by moving along demand, so quantity falls.
- Orange juice makers face higher costs, so supply of juice shifts left too.
Now add the numbers. Price elasticity of demand is the percentage change in quantity demanded divided by the percentage change in price, as OpenStax defines it. Suppose the price of oranges rises 10 percent and quantity demanded falls 4 percent.
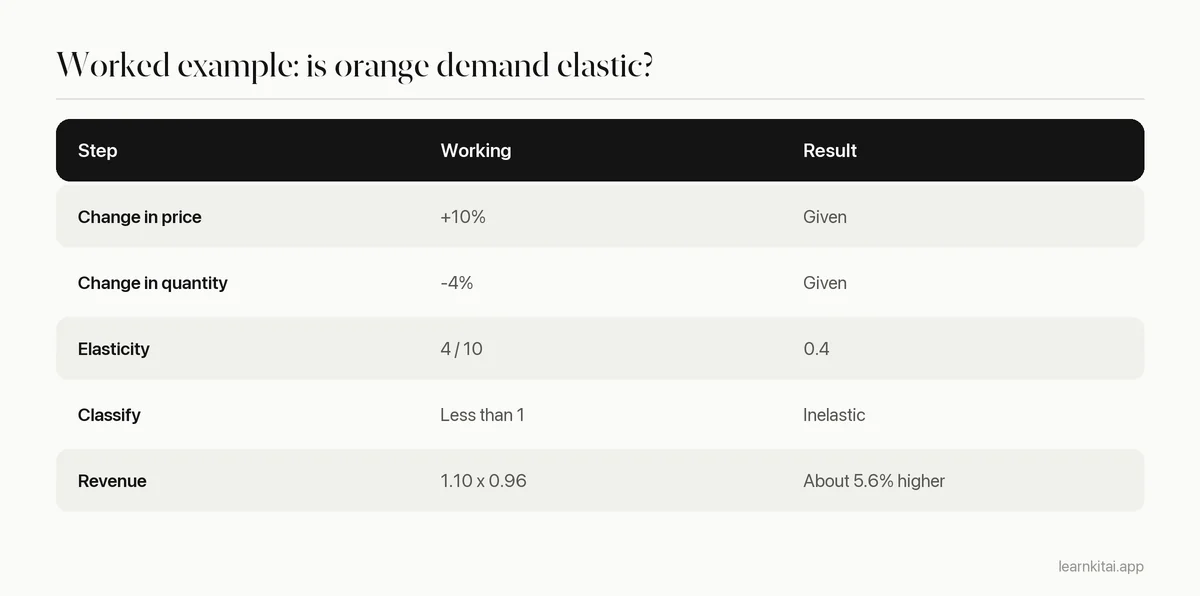
That last row is the kind of conclusion exams love: with inelastic demand, a supply shock can raise sellers' total revenue even as they sell less. Explaining this in your own words, as if to a friend, is the Feynman technique in action, and it shows you exactly where your understanding is thin.
Should you mix different types of economics problems?
Yes. Once you can do each type alone, mix them. On the exam you must decide whether a question is about elasticity, a price ceiling or a shift in demand. Mixed practice trains that decision; blocked practice by chapter hides it.
The evidence for mixing comes mostly from math, which shares this choose-the-method problem. In a randomized trial with 787 seventh graders, students whose practice interleaved problem types scored 61 percent on a surprise test, compared with 38 percent for those who practiced one type at a time. Our guide to interleaved practice explains how to build mixed sets from your own problem bank.
A simple way to start: write each practice question on an index card, label the back with the model it needs, shuffle, and before solving anything, name the model. Check the label, then solve. You will notice quickly which models you confuse.
How do you study macroeconomics differently?
Macro links several models at once, so study the connections. For each policy or shock, trace the chain through aggregate demand, output, unemployment and prices, and practice it in both directions: what happens, and what policy would push back.
In micro, one graph often answers the question. In macro, a single event ripples through several markets. A central bank raising interest rates touches borrowing, investment, aggregate demand, output, jobs and inflation, roughly in that order. Students who learn each of those as a separate definition struggle to follow the ripple.
Build a one page map of the main macro variables with arrows between them, and label each arrow with the mechanism. Then test yourself with short prompts: government spending rises, oil prices jump, consumer confidence falls. For each, trace the chain on the map from memory and draw the aggregate demand and supply graph that goes with it.
A weekly plan to study economics
Pair each lecture with a blank page graph drill the same day, a causal chain and calculation midweek, and a mixed problem set at the end of the week that includes older topics.
- Lecture day: redraw every new graph from memory, twice.
- Next day: write two causal chains using the new model.
- Midweek: five calculation problems, checked step by step.
- End of week: a shuffled set of past questions, old and new, with a quick review of every miss.
What are the most common economics study mistakes?
Copying graphs instead of drawing them blind, mixing up shifts and movements, memorizing conclusions without the chain behind them, skipping the math, and studying chapters in isolation. Each one shows up as lost marks on scenario questions.
- Unlabeled graphs. Examiners often give no credit for a correct shape with missing labels.
- Shifting both curves when only one moves. Ask which side of the market the event touches first.
- Learning macro as a list of definitions. GDP, inflation and unemployment connect through models like aggregate demand; study the links.
- Not keeping a mistake log. Write down every wrong answer and its cause, then redo it later. See our guide to the error log.
If you study economics alongside other quantitative courses, the same pattern applies: practice the representation the exam uses, not the one that feels comfortable. See our guide on how to study science for the broader approach, and dual coding for why pairing graphs with words strengthens memory.
Frequently asked questions
Is economics more math or theory?
Introductory courses are mostly theory with light algebra, while later courses add calculus and statistics. Even at the start, you need to calculate percentage changes, elasticities and areas on graphs. Practice the math alongside the ideas, not as a separate topic.
How do I study for an economics essay question?
Plan around a causal chain and a labeled diagram. State the model, draw it, explain each shift step by step, then evaluate, for example by discussing elasticity or time frame. Practice writing two or three full answers under time limits before the exam.
What is the difference between microeconomics and macroeconomics?
Microeconomics studies individual markets, firms and consumers. Macroeconomics studies the whole economy, including growth, inflation, unemployment and policy. The study methods are the same, but macro leans more on linking several models together.
How can I make economics stick if I find it boring?
Link each model to something in the news or your own spending. When you read about a price change, ask which curve shifted and why. Real examples give the abstract graphs a story you will remember.
Sources
- Principles of Economics 3e, Chapter 5 Key Concepts and Summary, OpenStax, Rice University (Definition of price elasticity of demand as percentage change in quantity demanded divided by percentage change in price; elastic vs inelastic.)
- Efficacy Study of Interleaved Mathematics Practice, Institute of Education Sciences, U.S. Department of Education (787 grade 7 students; interleaved practice scored 61 percent vs 38 percent on an unannounced test.)
Keep reading

How to Study Science: Think Like the Exam, Not the Textbook
Science asks for four kinds of knowledge at once: terms, mechanisms, problem skills and data. Here is how to study each one, and how they fit together.
Interleaved Practice: Why Mixed Sets Feel Worse but Work
Doing ten problems of the same type feels great and teaches less than you think. How to mix topics so you learn to choose the right method on exam day.

The Feynman Technique: Find Your Gaps by Teaching
If you cannot explain it simply, you have found what to study next. The four steps of the Feynman technique, a worked example and the traps that make it fail.
Error Log Studying: Turn Every Mistake Into Points
An error log is a simple table of every question you got wrong and why. Kept well, it becomes the most targeted study guide you will ever own.
Dual Coding: Pair Words With Pictures to Remember More
Your memory has a verbal channel and a visual one. Use both and ideas get two routes back. How to dual code your notes, with formats for every kind of topic.

Case Briefs: Read Like a Judge, Not a Stenographer
A good brief is short, written in your words, and built to answer the questions a professor or an exam will ask. Here is how to write one.